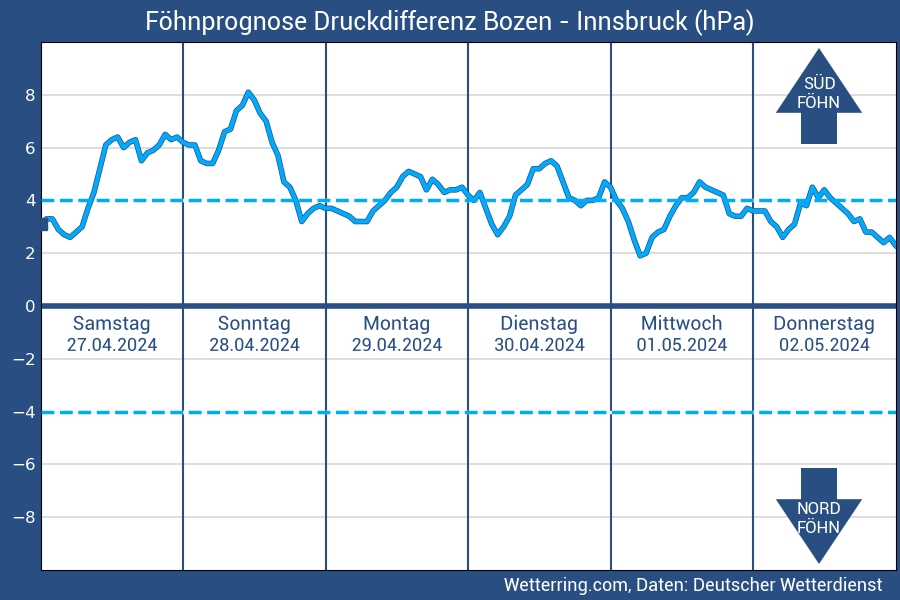
On this page, you can view a diagram that has always been extremely important for all water sports enthusiasts on Lake Como, Urnesee, etc.: the Foehn graph (or diagram).
Weather forecast: the Foehn Graph
The graph shows the expected pressure difference between Lugano and Zurich in hPa for the next days (source: https://profiwetter.ch/). The data is based on Meteomedia's MOS statistical method, and is updated every hour. A difference of -4 hPa (i.e. the air pressure in Zurich is higher than that of the air in Lugano) is the minimum value starting from which the genesis of the North Foehn, south of the Alps, can verify (and therefore, for example, over Lake Como), even if the actual formation of this wind also depends on other factors, such as the concomitant occurrence of the Bora wind in the upper Adriatic. The higher this pressure difference, the stronger the intensity of the North Foehn.
A difference of +4 hPa (the air pressure in Lugano is higher than that of the air in Zurich) is the minimum value starting from which the genesis of the South Foehn, north of the Alps, can occur (for example, in the famous Swiss spot of Urnersee).
It is a useful piece of information for planning our sessions.


Below, we also report the Foehn diagram, calibrated on the difference in atmospheric pressure between Bozen and Innsbruck in hectopascals [hPa] which is useful for forecasting the Foehn in Trentino - Alto Adige/Sudtirol (source: https://wetterring.at/), and therefore over Lake Garda, where however this wind generally enters poorly, i.e. it is very gusty. The foehn chart is updated twice daily: 10:00 and 22:00.

Have a good ride.
The Waterwind staff
P.s.: check also the Peler and Ora diagram for lake Garda.
Without your Support, Waterwind wouldn't exist. Become our supporter!
If you want to advertise with us, read here, or contact us.
Collaborate with us. Read here!
Buy our Gadgets! Visit our YouTube channel!


